An Introduction to R Shiny-Live Demo
R
Shiny
Interactive
Demonstration
Meetup description
Ihaddaden Mohamed El Fodil introduces RShiny that makes it easy to build interactive web apps. He then builds an impromptu shiny app for the meetup session.
He is a Shiny developer and an RStudio certified instructor. He also has a PhD in Economics and an avid R and Shiny developer.An Introduction to Shiny
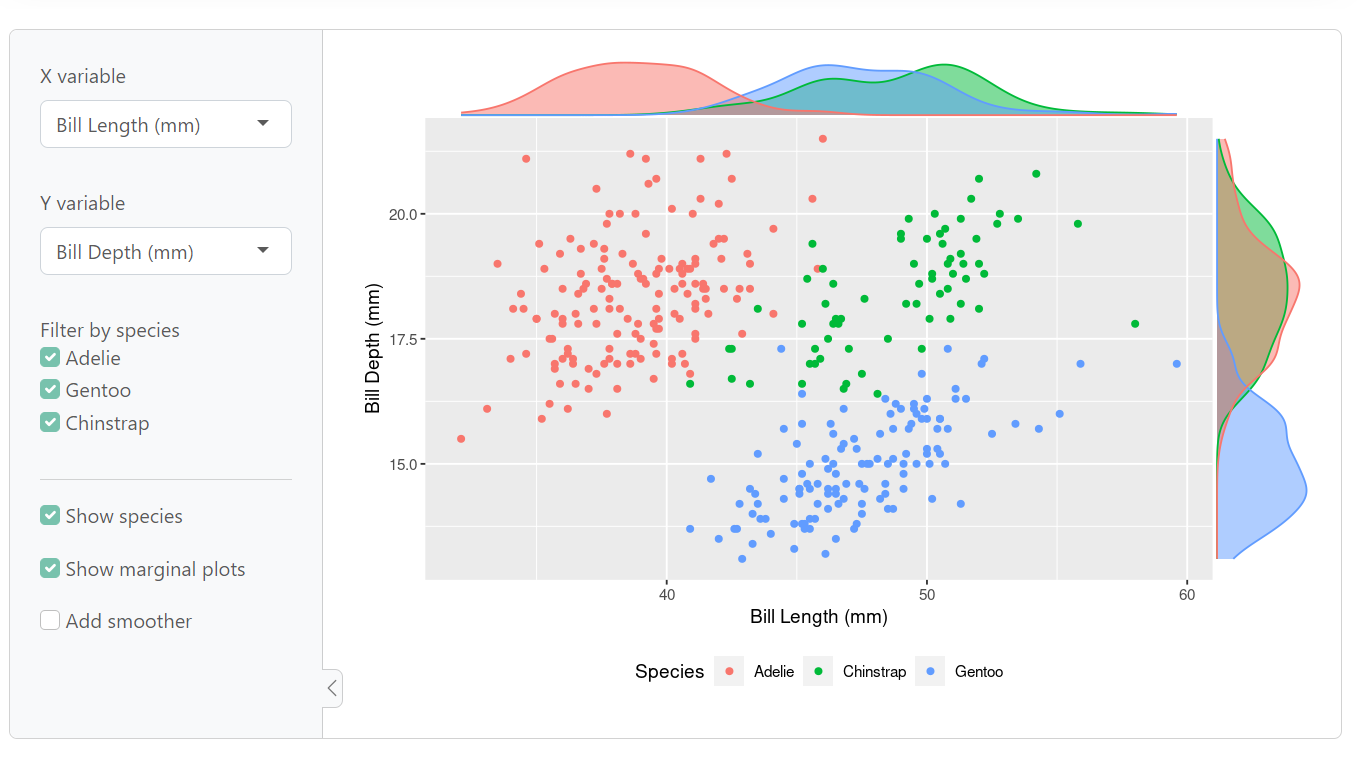
According to Ihaddaden, Shiny allows you to interact with the data by changing the data and analysis. The following code is a demonstration of a shiny app from https://shiny.posit.co/.
Learn how to develop a shiny app from here
library(shiny)
library(bslib)
library(dplyr)
library(ggplot2)
library(ggExtra)

penguins_csv <- "https://raw.githubusercontent.com/jcheng5/simplepenguins.R/main/penguins.csv"

df <- readr::read_csv(penguins_csv)
# Find subset of columns that are suitable for scatter plot
df_num <- df |> select(where(is.numeric), -Year)

ui <- page_sidebar(
  theme = bs_theme(bootswatch = "minty"),
  sidebar = sidebar(
    varSelectInput("xvar", "X variable", df_num, selected = "Bill Length (mm)"),
    varSelectInput("yvar", "Y variable", df_num, selected = "Bill Depth (mm)"),
    checkboxGroupInput(
      "species", "Filter by species",
      choices = unique(df$Species),
      selected = unique(df$Species)
    ),
    hr(), # Add a horizontal rule
    checkboxInput("by_species", "Show species", TRUE),
    checkboxInput("show_margins", "Show marginal plots", TRUE),
    checkboxInput("smooth", "Add smoother"),
  ),
  plotOutput("scatter")
)

server <- function(input, output, session) {
  subsetted <- reactive({
    req(input$species)
    df |> filter(Species %in% input$species)
  })

  output$scatter <- renderPlot({
    p <- ggplot(subsetted(), aes(!!input$xvar, !!input$yvar)) + list(
      theme(legend.position = "bottom"),
      if (input$by_species) aes(color = Species),
      geom_point(),
      if (input$smooth) geom_smooth()
    )

    if (input$show_margins) {
      margin_type <- if (input$by_species) "density" else "histogram"
      p <- ggExtra::ggMarginal(p, type = margin_type, margins = "both",
        size = 8, groupColour = input$by_species, groupFill = input$by_species)
    }

    p
  }, res = 100)
}

shinyApp(ui, server)