R Packages for Data Cleaning

Meetup Description
R-Ladies Brisbane hosted an event for R-Ladies Gaborone on the introduction to R packages for data cleaning, such as Naniar, Janitor, StringR and more with Simisani Ndaba as speaker. The meetup was a beginner friendly session with a second half detailed demonstartion. This was the first R Ladies collaboration for R - Ladies Gaborone. Paula Andrea Martinez was the R -Ladies Brisbane led organiser at the time and helped with the presentation arrangements. She is also a The Carpentries instructor which assisted with the structure of the presentation.
About Speaker
Simisani Ndaba has a history of working in the higher education industry having been working at the Department of Computer Science at the University of Botswana as a Teaching Assistant since 2016. She graduated with her Masters of Science in Computer Information Systems where her research work was based on Information Retrieval in Authorship Identification using authors’ writing styles from PAN at CLEF, a series of scientific events and shared tasks on digital text forensics and stylometry. Prior to that, she worked as a Junior Business Analyst at the Gauteng Department of Education working on data management and business intelligence in South Africa. She also holds a Bachelor’s degree in Business Information Systems and a Post Graduate Diploma in Education in Computer Science, a trainer qualification in October 2021. She is the founder and co-organiser of R-Ladies Gaborone.
Contact Speaker
contact Simisani @ simisani.ndaba013@gmail.com
R Packages for Data Cleaning
R packages for Data Cleaning is a follow up to a talk for the Codata Webinar 4: Importance of Data cleaning. That talk was rather generic to data science projects and not specific to actual work.
The R Data Cleaning packages used in the session are Janitor, Naniar, Amelia, Multiple imputation (as a missing values option), Data Wizard and Data Table for getting data prepared for analysis..
Code and presentation available on GitHub
Janitor

Janitor has simple functions for examining and cleaning dirty data. It was built with beginning and intermediate R users in mind and is optimized for user-friendliness. Advanced R users can already do everything covered here, but with janitor they can do it faster and save their thinking for the fun stuff.
The main janitor functions:
perfectly format data.frame column names;
create and format frequency tables of one, two, or three variables - think an improved
table(); andprovide other tools for cleaning and examining data.frames.
Janitor on CRAN: Simple Tools for Examining and Cleaning Dirty Data.
Naniar

Naniar aims to make it easy to summarise, visualise, and manipulate missing data. Naniar provides principled, tidy ways to summarise, visualise, and manipulate missing data with minimal deviations from the workflows in ggplot2 and tidy data. It does this by providing:
Shadow matrices, a tidy data structure for missing data:
bind_shadow()andnabular()
Shorthand summaries for missing data:
n_miss()andn_complete()pct_miss()andpct_complete()
Numerical summaries of missing data in variables and cases:
miss_var_summary()andmiss_var_table()miss_case_summary(),miss_case_table()
Statistical tests of missingness:
mcar_test()for Little’s (1988) missing completely at random (MCAR) test
Visualisation for missing data:
geom_miss_point()gg_miss_var()gg_miss_case()gg_miss_fct()
You can find more documentation on Naniar R Documentation and Naniar: Data Structures, Summaries, and Visualisations for missing data.
Amelia
Amelia on CRAN is a program for Missing Data. Amelia II is an R package for the multiple imputation of multivariate incomplete data. It uses an algorithm that combines bootstrapping and the EM algorithm to take draws from the posterior of the missing data. The Amelia package includes normalizing transformations, cell-level priors, and methods for handling time-series cross-sectional data. More Amelia R Documentation available here.
Multiple Imputation
Multiple Imputation (MI) is a general approach to the problem of missing data that is available in several commonly used statistical packages. It aims to allow for the uncertainty about the missing data by creating several different plausible imputed data sets and appropriately combining results obtained from each of them. In R, multiple imputation (MI) can be performed with the micefunction from the mice package as well apart from using the Amelia package. MI has multiple packages to use in R

Data Wizard package is used to easily manipulate, clean, transform, and prepare your data for analysis. Data Wizard is a lightweight package to easily manipulate, clean, transform, and prepare your data for analysis. It is part of the easystats ecosystem, a suite of R packages to deal with your entire statistical analysis, from cleaning the data to reporting the results.
Data Table

Data Table is an extension of data.frame package in R. It is widely used for fast aggregation of large datasets, low latency add/update/remove of columns, quicker ordered joins, and a fast file reader. Data table documentation at provides a high-performance version of base R’s data.frame with syntax and feature enhancements for ease of use, convenience and programming speed.
Data Cleaning Packages at work
The meetup session exercise gives a more precise demonstration to data filtering, manipulation and data visualisation. The meetup demonstration showed the process of;
- The installing and loading packages to be used.
library(Amelia)
library(naniar)
library(data.table)
library(datawizard)
library(janitor)
library(readr)
library(ggplot2)    #visualising missing values
library(dplyr)   # for the pipe function
library(readr)- A look into the NYC dataset from Kaggle that had the following summary.
HP <- read_csv("NYC_2022.csv")     #used readr read file function. fread
summary(HP)
View(HP)

Rows: 50 Columns: 17
-- Column specification -------------------------------------------------------------------------------------
Delimiter: ","
chr  (5): name, host_name, neighbourhood_group, neighbourhood, room_type
dbl (12): id, host_id, latitude, longitude, price, minimum_nights, number_of_reviews, reviews_per_month, ...
- Changing, removing and editing column using the packages Data Wizard and Janitor.
HP <- datawizard::data_remove(HP,"latitude") #remove data.frame,column
HP <- datawizard::data_remove(HP,"longitude") #remove data.frame,column
HP <- datawizard::data_remove(HP,"id")        #remove data.frame,column
HP <- datawizard::data_reorder(HP,c("host_id","name")) #add the names of the cols in the new order
HP <- datawizard::data_reorder(HP,c("host_name","name")) #add the names of the cols in the new order
HP <- datawizard::data_reorder(HP,c("host_id","host_name")) #add the names of the cols in the new order

HP <- janitor::clean_names(HP) #changes to lower case

HP <- datawizard::data_rename(HP,"price","house_price") #changes col name

janitor::get_dupes(HP,colnames(HP)) #checks whether there are any duplicates
janitor::tabyl(HP,host_name) %>% adorn_pct_formatting(digit=0,affix_sign=TRUE)  #col tabulation
janitor::top_levels(as.factor(HP$house_price),5) %>%    #shows the lowest, middle and highest numeric range
adorn_pct_formatting(digits = 0, affix_sign=TRUE)- Showing the missing values in the dataset using Naniar and ggplot for visualisation.
naniar::any_miss(HP) #check for NA
naniar::miss_var_summary(HP) #NA frequency
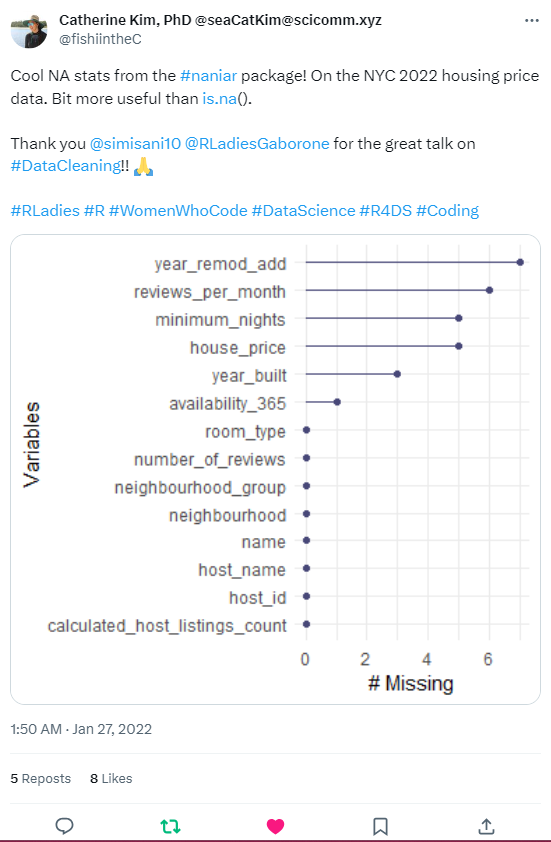
naniar::gg_miss_var(HP) #NA visualization
naniar::gg_miss_upset(HP,order.by="freq") #variable NA values relationship
ggplot2::ggplot(HP,aes(x=year_built,y=year_remod_add))+ #categorical variable
geom_miss_point()+
facet_wrap(~calculated_host_listings_count)+
theme_dark()- Setting data filtering and imputing missing data with Data.Table, Amelia and Naniar.
drop_dt <- data.table::as.data.table(HP) #set data.frame to data.table
drop_col <- c('name',                    #drop column
              'host_name',
              'neighbourhood',
              'neighbourhood_group',
              'room_type')
col <- drop_dt[,!drop_col,with=FALSE]   #create new table
res.amelia <- Amelia::amelia(col,m=9)  #5 imputed data sets
Amelia::compare.density(res.amelia,var="house_price")  #density plot to analysis
HP <- naniar::impute_mean_if(HP,.predicate = is.numeric)
naniar::any_miss(HP) #check if there are any NA- Setting the data frame to a data table format, more data filtering, Binary search and grouping using key setting.
View(HP_dt <- data.table::as.data.table(HP))   #set data frame to data table
class(HP_dt)
head(HP_dt[room_type=="Private room" & house_price>181500],4) #filtering rows based on conditions
head(HP_dt[,.(host_id,host_name,name)],4)   #select given columns
head(HP_dt[neighbourhood=="Harlem",.(neighbourhood,     #select given cols by row selection
                                     number_of_reviews,
                                     availability_365
                                     )],4)
#DT[i,j,by]/ SQL
head(average <- HP_dt[,.(mean_price=mean(house_price)), #grouping using by
                      by=neighbourhood],10)
head(   chain_gang <- HP_dt[, .( .N, maximum=max(house_price),  #chaining statement
                             minimum=min(house_price) %>%
                             round(2)),by=neighbourhood],4    )

#key concept for binary search. Sorts the data table by the key
data.table::setkey(HP_dt,neighbourhood)  #setting key for the data table
data.table::key(HP_dt)   #check data table key
head(HP_dt[.("Harlem")],3)     #select rows using key
room_by_neighbourhood <- HP_dt[.("Bedford-Stuyvesant"),
                               .(neighbourhood_group,neighbourhood,
                                room_type)]
head(room_by_neighbourhood)

#group using keyby
head(ans <- HP_dt["Hell's Kitchen",.(neighbourhood,
                                    max_review=number_of_reviews),
                                    keyby=availability_365],4)
key(ans)
key(HP_dt)
final <- data.table::merge.data.table(average,chain_gang)
head(final)
Twitter Posts

Youtube Link
Watch the recording of the meetup session.